


Sustainability is embedded in our culture and integrated into every aspect of our operations. We are systematically transitioning to cleaner technologies, increasing the share of green energy, enhancing efficiency, and adopting circular practices. Our long-term environmental strategy focuses on resource optimization and carbon reduction, aimed at ensuring a planet-positive future.


We are steadily advancing towards our GHG reduction goals with near-term science-based targets (SBTi) in place – to cut Scope 1, 2, and 3 emissions by 54.6% by FY2033 from the FY2020 baseline. In FY2025, 37.16% of our electricity consumption was from renewables, including 116,055 MWh from solar and 31,388 MWh from wind energy. The shift from oil to natural gas in furnace operations reduced Scope 1 emissions. Energy efficiency upgrades – including induction billet heaters, motors, and idle time optimization – lowered consumption by 3,343 MWh and avoided 2,430 tons of CO2 emissions. A detailed climate risk assessment was completed across all plants.
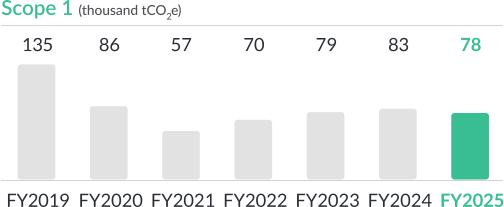
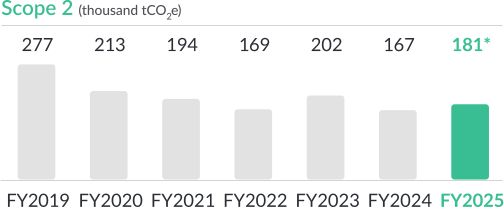
*Increment in Scope 2 emission is observed in FY2025 due to reduction in renewable energy generation and change in the emission factor considered for the estimation (CEA Version 20.0)
We aim to become water positive by 2030. All facilities operate on a Zero Liquid Discharge (ZLD) model, recycling treated water through Effluent and Sewage Treatment Plants. Real-time consumption is monitored via IoT-enabled digital meters. We completed a water risk assessment and identified site-specific actions to enhance resource resilience and reduce freshwater dependency.
In FY2025, 99.18% of waste generated was recycled. We recycle all metal scrap, process food and garden waste via composters, and use the resulting bio-manure in landscaping. Waste oil and ETP sludge disposal methods have been reconfigured to support our Zero Waste to Landfill target by 2030. All hazardous waste is managed in compliance with MPCB norms. A double materiality assessment was completed and the ESG roadmap updated. Our ISO certifications across sites reinforce performance in energy, environment, and safety management.
| FY2024 | FY2025 | Change (%) | |
|---|---|---|---|
| Energy Consumption (GJ) | 2,717,292 | 2,697,120 | 0.74 
|
| Scope 1 & 2 Emission Intensity (tCO2e / MT production) | 0.918 | 0.998 | 8.71 
|
| Scope 1 & 2 GHG Emission (Thousand tons CO2e) | 249 | 259 | 4.02 |
| % Renewable Energy of Total Electricity Consumed | 39.45% | 37.16% | 2.29  |
| Non-Hazardous Waste (Kg per MT of production) | 390.46 | 405.95 | 3.97 |
| Hazardous Waste (Kg per MT of Production) | 4.32 | 5.52 | 27.73 |
| Specific Water consumption (KL/MT Production) | 4.15 | 3.81 | 8.19 |
| % Recycle of Water of Total Water Consumption | 33.17% | 40.84% | 7.67  |
| Wastewater Discharge (m³/day) | 0 | 0 | - |
| LTIFR (Lost Time Injury Frequency Rate) | 0.92 | 0.44 | 52.00 |
| Use of Secondary Raw Material | 40% | 41% | 1.00 |


